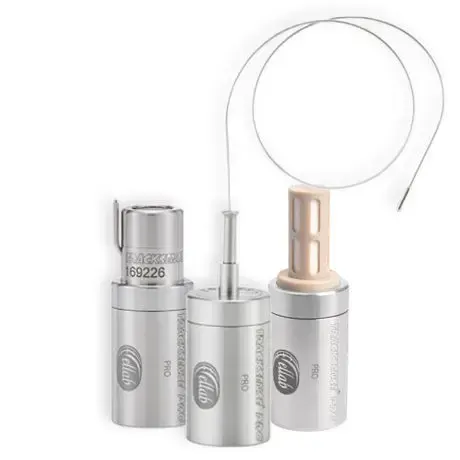
- Validation
- Probe
Ellab
Ellab TrackSense Pro
- Range
- -200 to +400°C
- Accuracy
- ±0.05°C
- Connectivity
- Wireless validation
- Use
- Reusable
₹80,000 – ₹1,50,000indicative
Before a warehouse, cold room, freezer or stability chamber can store GMP products, you need to prove it holds temperature evenly, including in its warmest and coldest corners. Temperature mapping does that, and it's only as reliable as the data loggers you use. Explore high-accuracy validation loggers for mapping and qualification studies, with full specs and indicative prices in INR, plus a practical guide to planning your mapping study. Temperature mapping data loggers are also called validation loggers, thermal mapping loggers or qualification loggers. They're used for warehouse, cold room and freezer mapping, and for temperature validation of autoclaves and stability chambers.
What is a temperature mapping data logger?
A temperature mapping data logger is a high-accuracy logger used in groups to record temperature, and often humidity, at many points across a warehouse, cold room, freezer or chamber at the same time. The combined data reveals hot and cold spots and supports GMP qualification.
9 models · 6 brands · indicative ₹7,499 to ₹15,00,000
Ellab
₹80,000 – ₹1,50,000indicative
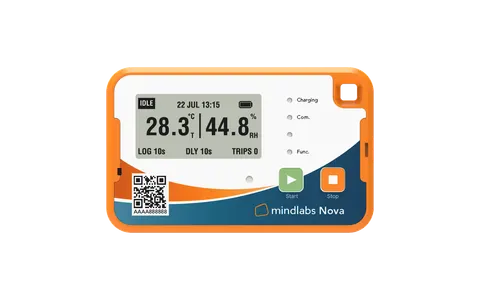
Mindlabs
Starting at ₹7,499
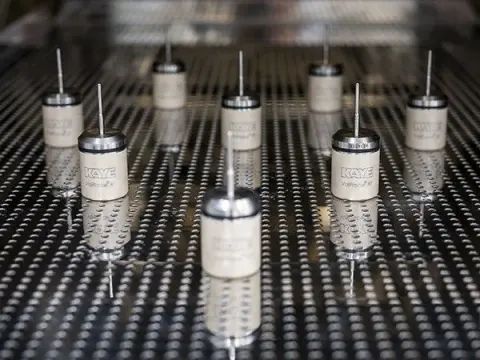
Kaye
₹90,000 – ₹1,80,000indicative
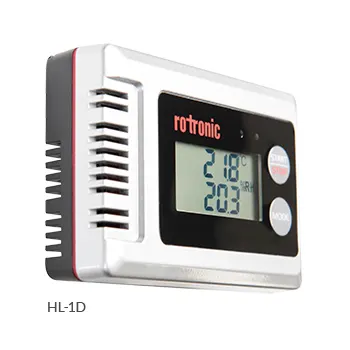
Rotronic
₹12,000 – ₹20,000indicative
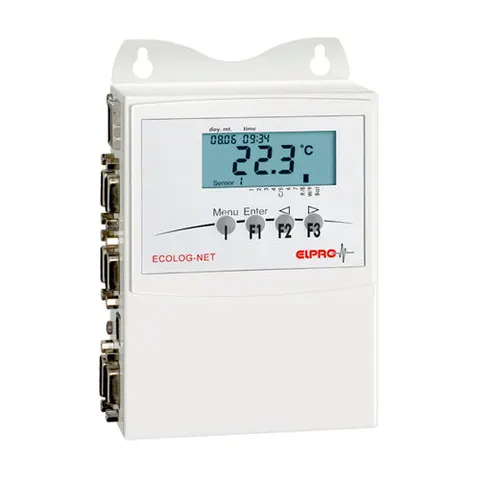
ELPRO
₹35,000 – ₹70,000indicative
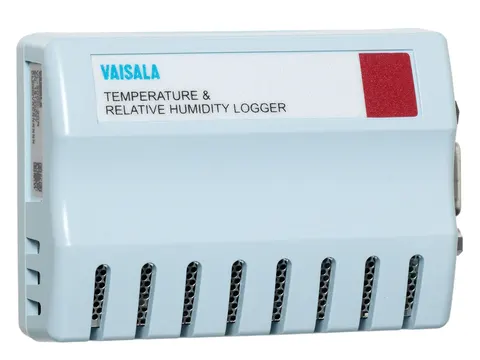
Vaisala
₹55,000 – ₹90,000indicative
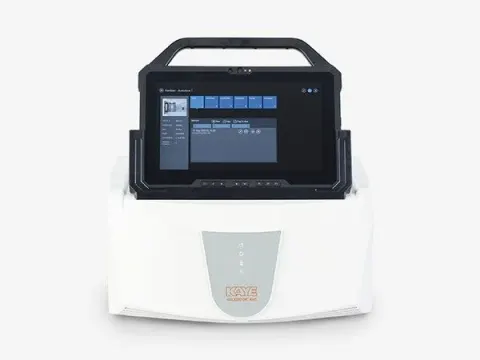
Kaye
₹8,00,000 – ₹15,00,000indicative
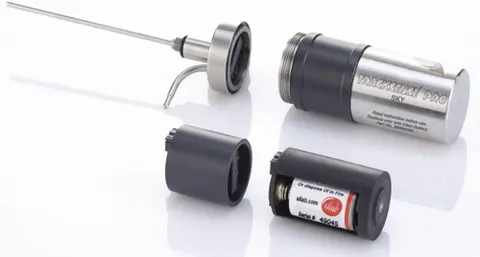
Ellab
₹1,20,000 – ₹2,00,000indicative
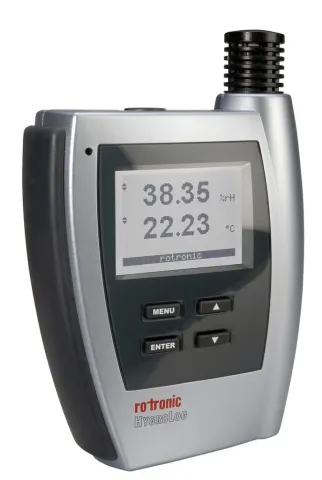
Rotronic
₹60,000 – ₹1,00,000indicative
Many QA teams in India map warehouses, cold rooms and fridges with general-purpose loggers like these.
| Model | Accuracy | Range | Indicative price |
|---|---|---|---|
| Testo 174H | ±0.5°C, ±3 %RH | -20 to +70°C, 0–100 %RH | ₹7,000 – ₹11,000 |
| Elitech RC-4HC | ±0.5°C, ±3 %RH | -30 to +60°C, 0–99 %RH | ₹2,500 – ₹4,000 |
| LogTag UHADO-16 | ±0.45°C, ±3 %RH | -30 to +70°C, 0–100 %RH | ₹6,000 – ₹9,000 |
| TempU TempU03 | ±0.5°C, ±3 %RH | -30 to +60°C, 0–85 %RH | ₹1,300 – ₹3,500 |
| Option | Price per logger | Cost for 10 loggers |
|---|---|---|
| Mindlabs Nova | Starting at ₹7,499 | ₹74,990 |
| Testo 174H | ₹7,000 – ₹11,000 | ₹70,000 – ₹1,10,000 |
| Elitech RC-4HC | ₹2,500 – ₹4,000 | ₹25,000 – ₹40,000 |
| Vaisala DL2000 | ₹55,000 – ₹90,000 | ₹5,50,000 – ₹9,00,000 |
Mapping services in India are typically quoted per day or per study.
Temperature mapping is a study that measures how temperature, and often humidity, varies across a storage space over time. Data loggers are placed at many points, top to bottom, front to back, near doors and cooling units, and record simultaneously, usually for several days.
The results show where the hot and cold spots are, how quickly the space recovers after doors open, and whether every location stays within the required range. They decide where permanent monitoring sensors should go and which areas shouldn't be used for sensitive products.
Mapping is expected under GMP and GDP guidelines for any space storing temperature-sensitive products, including WHO guidance on temperature mapping of storage areas.
| Aspect | Temperature mapping | Validation (qualification) | Continuous monitoring |
|---|---|---|---|
| Purpose | Find hot and cold spots and variation across a space | Prove equipment or a space performs as required | Watch conditions day to day |
| When | Before use, after changes, periodically | Installation (IQ), operation (OQ), performance (PQ) | Always, after qualification |
| Loggers | Many, temporary, high-accuracy | Mapping loggers plus documentation | A few fixed sensors at critical points |
| Output | Mapping report with logger positions and data | Qualification protocol and report | Ongoing records and alarms |
Mapping is usually part of the validation (operational and performance qualification) of a space. Once qualified, a wireless monitoring system watches the critical points found during mapping.
Plan. Write a mapping protocol: the space, acceptance range, number and positions of loggers, logging interval, study duration and test conditions.
Place the loggers. Position loggers in a 3D grid across the space at low, middle and high levels, plus suspected problem areas: near doors, cooling units, lights, external walls and air vents.
Record. Run the study long enough to capture normal variation, typically several days, including a weekend and normal working patterns. Many studies also include door-opening and power-failure tests.
Analyse. Download all loggers, identify hot and cold spots, check every position against the acceptance range, and calculate mean kinetic temperature (MKT) where required.
Report and act. Document results, decide where permanent monitoring sensors go, mark unusable zones, and fix any problems found.
For a detailed walkthrough, see our step-by-step temperature mapping study guide.
There's no single fixed number. It depends on the size, shape and use of the space. As a practical guide:
Use your mapping protocol and applicable guidelines to justify the final number. For repeat studies, buying your own loggers is often cheaper than renting.
±0.5°C is widely used for warehouse, cold room and fridge mapping; ±0.1–0.2°C is needed for process validation (autoclaves, stability chambers). Check the accuracy across your full operating range, not just at room temperature.
Each logger needs a calibration certificate traceable to national standards, ideally from an NABL or ISO 17025 accredited lab. Check calibration before and, ideally, after each mapping study.
Match the logger to the space: 2–8°C for cold rooms, -20°C or -80°C for freezers (often with probes), and higher ranges for autoclaves, ovens and depyrogenation tunnels.
For warehouses and stability chambers, choose loggers that map humidity as well as temperature.
All loggers must start and record on the same clock, so readings at each position can be compared at the same moment. Software that configures every logger at once makes this easy.
Mapping usually uses short intervals (1 to 5 minutes) over several days. Make sure memory covers the full study at your chosen interval.
Mapping software should export data for all loggers together, flag out-of-range positions, calculate MKT and support 21 CFR Part 11 audit trails where required.
Small loggers fit between shelves and products without disturbing airflow. Magnets, clips or hooks make placement faster and repeatable.
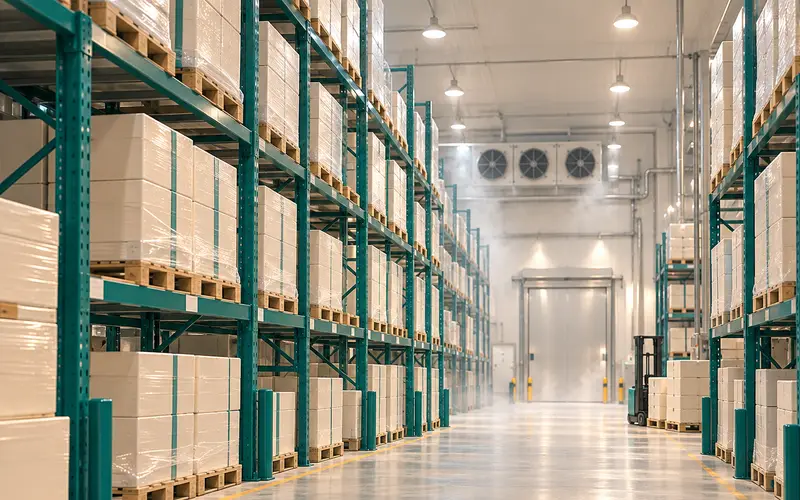
Pharma warehouses: GDP mapping of ambient and controlled-temperature storage.
Cold rooms and walk-in chillers: 2–8°C storage of medicines and vaccines.
Freezers and ultra-low freezers: -20°C and -80°C storage of biologics and samples.
Stability chambers: ICH stability studies with temperature and humidity mapping.
Incubators and laboratory equipment: qualification of lab and QC equipment.
Reefer vehicles and containers: mapping refrigerated transport before use.
Autoclaves, ovens and tunnels: high-temperature process validation, using specialised probes.
Map in-house if you map regularly, have trained QA staff, and want to control timing. Owning a set of loggers usually pays back after a few studies.
Use a mapping service for a one-off study, very large or complex sites, or if you lack staff or documentation templates. The service provides loggers, protocol, execution and report.
Either way, the logger specifications on this page help you judge quality. Ask service providers which loggers they use and for their calibration certificates.
On this site, validation and temperature mapping loggers range from about ₹7,499 to ₹15,00,000. Entry-level mapping loggers cost a few thousand rupees each, while high-accuracy validation systems with wireless loggers and dedicated software can cost several lakh.
When budgeting for in-house mapping, consider:
Tell us the spaces you need to map, and we'll recommend the right loggers and share the best price.
Browse validation and mapping loggers by brand.
Mapping and validation
How to plan, run and report a temperature mapping study for warehouses, cold rooms, freezers and fridges.
Calibration
How often to calibrate, what NABL traceability means, and what a valid calibration certificate must show.
A temperature mapping data logger is a high-accuracy logger used in groups to measure temperature, and often humidity, at many points across a storage space at the same time. The data shows hot and cold spots and proves whether the whole space stays within its required range.
It depends on the size and shape of the space. Fridges and freezers usually need around 9 to 15 loggers, walk-in cold rooms 15 to 30, and large warehouses 50 or more, arranged in a 3D grid plus problem areas near doors, cooling units and walls.
Most mapping studies run for several days, often around 7, to capture normal daily and weekly variation, including weekends and door openings. Warehouses are often mapped in both summer and winter.
±0.5°C is widely used for warehouse, cold room and fridge mapping; ±0.1–0.2°C is needed for process validation (autoclaves, stability chambers). Check the accuracy across your full operating range, not just at room temperature. Each logger should have a traceable calibration certificate, checked before and ideally after the study.
Mapping is a temporary study using many loggers to understand temperature variation across a space and find hot and cold spots. Monitoring uses a few fixed sensors, placed at the critical points found during mapping, to watch conditions continuously.
Map before first use, after any significant change to the space, equipment or layout, and periodically as defined in your quality system, often every one to three years. Seasonal mapping is common for warehouses.
Mean kinetic temperature is a single calculated temperature that reflects the overall thermal stress on a product over time, weighting high temperatures more heavily than a simple average. It's used in pharma storage and stability studies to assess the impact of temperature variation.
Validation and mapping loggers listed on this site range from about ₹7,499 to ₹15,00,000. Entry-level mapping loggers cost a few thousand rupees each, while high-accuracy wireless validation systems with software cost considerably more.
Tell us the spaces you need to map and their temperature ranges, and we'll recommend the right loggers and send a quote.